
volume 15, Article number: 1711 (2025)
Abstract
The Arabian Peninsula (AP) has been reported to experience increasing drought in recent decades. With this background, this study evaluates best performing Climate Model Intercomparison Project 6 (CMIP6) Global Climate Models (GCMs) for historical (1985–2014) simulations and future drought projections across the AP until 2100, using the standardized precipitation index (SPI) and standardized precipitation–evapotranspiration index (SPEI). We assess uncertainties from model differences, scenarios, timescales, and methods. Our findings reveal the limitations of most models in reproducing precipitation, leading to uncertainties in SPI projections. Nonetheless, CMIP6-GCMs better capture the increase in the current-day potential evapotranspiration (PET) and therefore the SPEI, which is dominated by PET. The Hargreaves based PET is identified as the most suitable method for SPEI projections. The rate of increase in PET surpasses that of precipitation in all scenarios by fivefold. Consequently, SPEI indicates projected increase in future droughts with greater changes in SSP585 and SSP370 scenario compared to SSP245 and SSP126. In general, drought will exacerbate in the AP despite uncertainties from indices selection, scenarios, and inter-model variability, followed by methods and timescales which predominantly impacts drought magnitude. Over findings emphasize the need for more reliable representation of the AP precipitation in climate models for improved drought projection over the AP to enhance planning and adaptation strategies.
Introduction
Anthropogenic climate changes directly influence the spatiotemporal extent of hydroclimatic extremes1,2,3, leading to changes in the averages, variability, and distribution of driving parameters such as temperature and precipitation4,5. In this sequence, the frequency and severity of droughts have noticeably increased since the mid-20th century in many regions across the globe and enhanced risk has been projected for the future under changing climate scenarios1, albeit with uncertainties in spatiotemporal pattern. Observational and modeling studies have demonstrated a decrease in global soil moisture and a growth in drought occurrences recently6,7. By contrast, Sheffield and Wood8reported trends of increasing moisture, particularly in the northern latitudes. Moreover, a few studies have suggested that drought patterns have exhibited only limited changes in recent decades9,10. These contrasting results have led Trenberth et al.4 to conjecture that global warming would amplify the droughts rather than initiate them.
In a hyper arid region such as the Arabian Peninsula (AP), where water scarcity and population growth are already pressing concerns, droughts have become even more critical for regional agriculture and water resources11,12. The AP region is projected to experience more dryness under a warming climate due to the northward expansion of Hadley cells13, although considerable uncertainty is associated with climate change signals2,14. Indeed, recent studies have indicated that drought frequency and severity have considerably increased over the AP in the past few decades15,16. Saharwardi et al.16 highlighted the roles of natural variability and long-term warming trends, which are likely to be associated with increasing anthropogenic activities, in escalating recent droughts.
Several studies have analyzed uncertainties in the future climate of the AP using different versions of Climate Model Intercomparison Project (CMIP) models17,18. CMIP5-Global Climate Models (CMIP5-GCMs) projections indicate a decrease in the precipitation under different emission scenarios19. In particular, the analysis of outputs from regional climate models suggest that the entire Middle East may experience longer and more severe droughts in the future20. Waha et al.21suggested that a shift in the large-scale atmospheric patterns could lead to changes in moisture patterns, causing dryness in the north and wetter conditions in the southern AP. Particularly for the AP, projections from the latest CMIP6-GCM simulations indicate a mixed pattern for the future precipitation18. However, considerable inter-model and/or observation-based uncertainties have been noted across the Middle East in terms of mean precipitation and its variability and trends as well as simulated historical and future climate statistics12,16. In contrast, climate model projections from several studies indicate a consensual and more robust trend of increasing temperature in the future over the region, although with varying magnitude under various emission scenarios12,18,22. Areas with low vegetation and limited evaporation in the AP are noted to have experienced higher temperatures than surrounding barren lands23and are expected to face increased risk of drought due to the greater atmospheric evaporative demand under a warming climate12,20. Studies have indicated that the rate of increased evaporation could outpace precipitation changes, potentially resulting in increased dryness24. In contrast, erstwhile rarely occurring extreme precipitation and associated floods have increased in the AP region in the recent past25,26, and further projected to increase in the warming climate27. Indeed, uncertainties in representing these contrasting but important processes pose challenges for future drought projections.
Uncertainties in drought projections primarily arise from several factors, such as the model selection vis-a-vis the choice of observational dataset used for validation28,29, inter-model spread, internal variability, selected scenarios, choice of drought indices and their threshold values, and calculation methodology9,30,31,32. The differences among models are commonly attributed to distinct physical assumptions integrated into their formulations, which often pose challenges for a straightforward conclusion33,34. Similarly, uncertainties associated with drought indices depend heavily on parameters used in the index calculations31. However, choosing an emission scenario makes it necessary to consider a comprehensive range of potential climate trajectories35,36.
As discussed above, despite the uncertainties in the simulated AP climate using CMIP models, projections from these models have been used to interpret future climate changes while considering the uncertainties involved18,27,37. However, no studies have comprehensively examined the projected future drought evolution over the AP, which remains an important problem in the context of increasing drought frequency. Quantifying the inherent uncertainties in how the drought pattern could change across the AP in the future is also an important question that needs to be addressed.
Therefore, the main objectives of this study are to comprehensively analyze future drought projections over the AP and to report an assessment of the related uncertainty. To this end, we utilized most of the available CMIP6-GCM datasets because relying on just a few models can introduce uncertainty in the results38,39. Further, from this initial pool of CMIP6 GCMs, we selected models that reproduce the observed climate statistics over the AP using a well-defined protocol. In addition, we analyzed the four most commonly used shared socioeconomic pathway (SSP) emission scenarios prescribed by the IPCC-AR6 to account for various future emissions40. We analyzed the two most frequently used drought indices32,41: the standardized precipitation index (SPI) and standardized precipitation evapotranspiration index (SPEI). While the SPI is typically used to diagnose droughts from the perspective of precipitation, the SPEI explores droughts based on changes in water balance (precipitation–potential evapotranspiration (PET)). We demonstrated that the choice of index and methodology by which drought indices are computed are critical sources of uncertainty, particularly in an arid and desert region such as the AP. Moreover, we also discussed uncertainties associated with timescales and base period selections.
The remaining manuscript is organized as follows: Starting from data and methods, then results and discussion and finally summary and conclusions.
Dataset and methods
Datasets
We analyzed historical monthly precipitation and temperature datasets from 57 CMIP6-GCMs for the period 1985–2014. However, we analyzed the future projections of drought for the period 2015–2100 using the selected CMIP6-GCMs. The precipitation climatology for the same period from all the models is shown in supplementary Fig. S1. The CMIP6 models, in general, boast substantial advancement over the earlier CMIP generations in many ways, such as higher resolution, improved regional parameterizations, and better representation of synoptic processes, and global energy balance42. We selected four different SSP emission scenarios, namely SSP126, SSP245, SSP370 and SSP585, for 2015–210041,43. We calculated multi-model mean (MMM) of the selected models simulated hydroclimatic variables. While many studies advocate for using bias-corrected data in climate change research, Maraun44argues that this approach may not accurately capture future climate trends and variability and requires further investigation. Although bias correction can align model data with observed ranges, it might lead to misleading future projections due to an incomplete understanding of climate change signals. In contrast, Knutti et al.38 and Ahmed et al.45 suggests that MMM is a more reliable method for climate projection and model interpretation.
We further used global precipitation and temperature datasets from Multi-Source Weather (MSWX), available at 0.25° × 0.25° horizontal resolution46. The MSWX is an operational bias-corrected meteorological dataset that has been available since 1979. The MSWX data was generated based on ERA5 data, which is bias-corrected and downscaled using high resolution monthly or annual climatologies46. The dataset was downloaded from https://www.gloh2o.org/mswx/. We used these datasets as a reference to evaluate the performance of the CMIP6 models in capturing the observed precipitation and temperature statistics over the AP during the historical period 1985–2014. The MSWX datasets were used because (1) they offer high resolution and bias correction for quality-controlled ground and satellite observations and (2) both MSWX temperature and precipitation datasets exhibit a high correlation of 0.98 with the corresponding averages of several gridded observation-based datasets29. For intercomparison, we have first re-gridded all the datasets (observation and models) using the bilinear interpolation method to a common resolution of 0.5° × 0.5°.
Methods
Model dataset selection
The selection of climate models is an important process in climate change studies47. Numerous studies have demonstrated that many of the CMIP models are similar and dependent on each other, which reduces the uncertainty in simulated climate statistics while perpetuating the biases of the dominant groups of models39,48,49. This is because several climate models are developed by the same institutes and share similar processes and parameterizations, and they may even share similar code-sharing concepts29. Therefore, selecting models that are independent of one another aids in estimating a more realistic uncertainty. With this in mind, we first selected the independent models. Then, we assessed the fidelity of the simulated climate statistics for the AP for the historical period by each model to further narrow down the model selection, as detailed hereafter.
We initially analyzed the 57 CMIP6-GCM–simulated precipitation and mean temperature datasets for the historical period (1985–2014) to identify the similarity and independence between models. For this, we initially divided all models into different groups according to the criterion that the correlation between them was above 99th percentile (Correlation Coefficient (CC) = 0.72) (refer to Fig. 4 of Pathak et al.29). We selected one independent model from each group and then identified the models with best skill score over the AP and data availability for the four scenarios (SSP126, SSP245, SSP370 and SSP585). We mostly used the first variant level, “r1i1p1f1,” except for a few models for which this variant was unavailable (https://ukesm.ac.uk/cmip6/variant-id/).
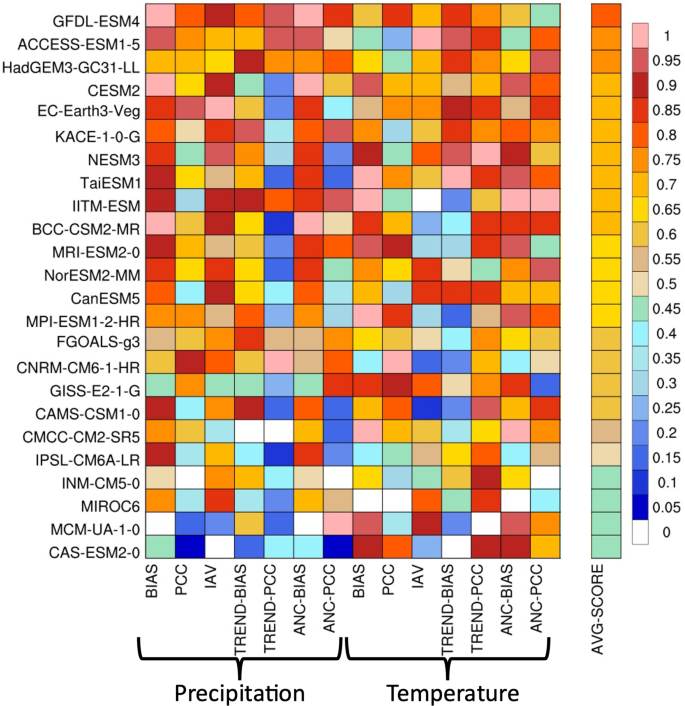
We adapted the methodology reported by Kotlarski et al.50 and Pathak et al.29 to calculate the skill scores of each independent model. The selection methodology involved a rigorous combination of performance metrics, including spatial mean bias (BIAS), pattern correlation (PCC), the ratio of interannual variability (IAV), bias in trend (TREND-BIAS), pattern correlation in trend (TREND-PCC), bias in the annual cycle (ANC-BIAS), and pattern correlation within the annual cycle (ANC-PCC), for precipitation and temperature over the AP. Briefly, seven matrices were calculated for each model \(\:m\), variable \(\:q\), and season \(\:k\) across all grid points (N) in the region. All matrices were calculated for each season (DJF, MAM, JJA, and SON), and the corresponding climatological values were also obtained.
Generally, for each of the models the performance scores for biases\(\:\:({P}_{S}\)), similarity in spatial pattern (\(\:{P}_{R})\), and interannual variability (\(\:{P}_{\sigma\:}\)) were calculated using the equations below.
The spatial mean performance score for bias (\(\:{P}_{S}\)) was determined by averaging the climatological bias (\(\:e\)) between the model and the observations over all grid points as follows:
$$\:{e}_{n,m}^{q,k}=\left({\overline{\text{y}}}_{n,m}^{q,k}-{\overline{\text{o}}}_{n}^{q,k}\right),$$
(1)
$$\:{P}_{S}^{q,k,m}=\sum_{n=1}^N{e}_{n,m}^{q,k},$$
(2)
We denoted monthly observational and climate model data at grid point \(\:n\) as \(\:{o}_{n}\)and \(\:{y}_{n}\). The single overbar in Eq. 1 indicates the temporal mean over the relevant time steps in the study period for season \(\:k.\)
We further calculated the spatial pattern similarity performance score (\(\:{P}_{R}\)) using pattern correlation, which, for clarity, was expressed by dropping the indices \(\:q,k,m\) as follows:
$$\:{P}_{R}=\frac{cov\left({\overline{\text{y}}}_{n},{\overline{\text{o}}}_{n}\right)}{\sigma\:\left({\overline{\text{y}}}_{n}\right)\sigma\:\left({\overline{\text{o}}}_{n}\right)},\:\:n=1\dots\:.N,$$
(3)
where \(\:cov\) and \(\:\sigma\:\) denote spatial covariance and standard deviation, respectively.
The interannual variability performance (\(\:{P}_{\sigma\:}\)) was evaluated using the ratio of the standard deviation of a yearly-varying model simulation and observation as follows:
$$\:{P}_{\sigma\:}=\frac{\sigma\:\left(\overline{\overline{\text{y}}}\right)}{\sigma\:\left(\overline{\overline{\text{o}}}\right)},$$
(4)
Two overbars reflect the temporal mean across all time steps that falls into season \(\:k\) in a year, and spatial means. To ensure that lower values would indicate better GCM performance, we converted bias values to absolute values, and the pattern correlation and ratio of interannual variability were converted as follows:
$$\:{P}^{{\prime\:}}=|1-P|,$$
(5)
These performance scores were further standardized to obtain the respective score (\(\:S\)) between “\(\:zero\)” and “\(\:one\)” for a particular model \(\:j\) and performance metric \(\:m\)(indices for season \(\:k\) omitted):
$$\:{S}_{j,m}=1-\frac{{P}_{j,m}-\text{m}\text{i}\text{n}\left({P}_{m}\right)}{\text{max}\left({P}_{m}\right)-\text{m}\text{i}\text{n}\left({P}_{m}\right)},$$
(6)
where \(\:\text{m}\text{i}\text{n}\left({P}_{m}\right)\) and \(\:\text{m}\text{a}\text{x}\left({P}_{m}\right)\) indicate the minimum and maximum values, respectively, of 24 \(\:{P}_{j,m}\). In contrast to the performance metric \(\:{P}_{j,m}\), the larger the value of the score \(\:{S}_{j,m}\), the better a particular CMIP6 model performs on a given performance metric. The final overall normalized scores for each observational dataset and variable were then calculated independently for each CMIP6 \(\:j\) by computing the average over four seasons (K) and three performance metrics (M):
$$\:{\overline{S}}_{j}=\frac{1}{M\text{*}K}\sum_{m=1}^M\sum_{k=1}^{K}{S}_{j,m,k},$$
(7)
Hence, each performance score was given equal weight. The CMIP6 models were then ranked based on the obtained \(\:{\overline{S}}_{j}\). Based on the performance score, we selected the top models to determine the regional hydro-climatology and drought variability for both historical and future periods.
Drought indices and characteristic calculation
We calculated the SPI and SPEI for the observations and for each of the selected models for the historical period, as well as for future periods for all four SSP scenarios. Both indices explore drought variability at multiple timescales and have been used in several studies over the AP15,16. Previous studies have also suggested the use of both of these indices for projecting future droughts over different regions to examine the sensitivity of the projections to the relevant index choices32,41,51. A few studies also used PDSI52; however, it has been noted that PDSI does not capture well the multiscale nature of drought along with several other deficiencies53,54.
The SPI at a location is typically computed as an integrated index over different monthly time scales (1, 2, 3…. n months) from precipitation datasets55. At the outset, monthly precipitation anomalies were computed from prolonged monthly precipitation datasets. The resultant time series for the monthly anomalous precipitation was subsequently fit to the gamma probability distribution analysis via a maximum likelihood estimation55. Ultimately, the resulting data were normalized to yield the time series of the SPI index with a mean zero and a standard deviation one.
Although the SPI enables us to identify changes in drought characteristics that are only associated with precipitation variability55, it does not encompass the impact of temperature variability, which is prominent in the AP.
Meanwhile, for calculating SPEI, a value for the monthly water balance parameter Di(for month i) is required, which was obtained as precipitation–PET and used as the input data56. Thus, the SPEI is a more comprehensive index and more appropriate for assessing droughts in the AP16.
The computation of the SPEI for a location involves fitting the time series of the local water balance parameter to a log-logistic distribution56. Notably, several methods exist for calculating PET, such as the Hargreaves and Samani, Thornthwaite, and Penman–Monteith (PM) methods57. Although the PM method is the recommended method, its computation entails many parameters. In our SPEI formulation, we employed the Hargreaves and Samani method to calculate PET58. This method is considered a suitable alternative to the PM method59,60. In addition to its better performance in assessing drought in the AP16, the Hargreaves and Samani methodology has been reported as a suitable method for use in drought projection studies for other regions as well32,60.
The equation for calculating PET, based on the Hargreaves and Samani58 (1985) method, is given as follows:
$$\:PET=0.0023{R}_{a}\left(\frac{{T}_{max}+{T}_{min}}{2}+17.8\right)\sqrt{{T}_{max}-{T}_{min}},$$
(8)
where Tmin and Tmax are the minimum and maximum temperatures, respectively, and Ra is the extraterrestrial radiation.
PET for any month i is obtained by subtracting the monthly PET from the corresponding precipitation.
$$D_i =Pr – PET,$$
(9)
The Di value is used to calculate SPEI, which is similar to the SPI calculation, with the only difference being that the Di is fit to a log-logistic distribution.
In addition, we tested the sensitivity of the SPEI to the choice of the PET computational methodology by calculating it using the Thornthwaite method61.
The choice of the reference period plays a crucial role in the calculation of drought indices, and this is a factor that is often overlooked62,63. This oversight can significantly impact the assessment of the severity and spatial extent of droughts, as is highlighted by Um et al.64. Here, we follow the common practice of considering the historical period as a reference for fitting the future distribution41,65. This comprehensive approach enables a comparison of changes in drought with respect to the base period that is common for all scenarios. The current study generally focuses on analyzing drought characteristics at a 12-month timescale using the SPI and SPEI indices. However, we explore sensitivity of drought indices to changes in timescales and seasons by examining drought frequency at two different timescales.
The drought projections are assessed for different subperiods: the near (2015–2044), mid (2045–2074), and far (2075–2100) future for all four SSP scenarios. To calculate the drought duration, we identify a month as being in drought whenever the corresponding value of the SPI/SPEI is less than − 1. However, the frequency of drought is defined as the year under the drought whenever the corresponding value of the SPI/SPEI is less than − 1.
Results and discussion
Models evaluation and performance
The spatial distributions of precipitation for each 57 CMIP6-GCMs during the period 1985–2014 are presented in Supplementary Fig. S1. We observe that many models from the same organization show almost similar spatial patterns of precipitation over the AP. For instance, all five EC-Earth models depict almost identical distributions for precipitation (see Supplementary Fig. S1), which can be because the parent organization shares similar processes, concepts, and codes48,49. If similar models were used to compute the ensemble mean, the mean is likely to be influenced by common systematic biases, as demonstrated by Pathak et al.29. Therefore, from the initial pool of 57 CMIP6-GCMs, one model was selected from 24 groups, resulting in 24 independent models (see Supplementary Table S1).
We further evaluated these 24 selected models by comparing the simulated precipitation and temperature over the AP against the corresponding observations in the reference period. The performance metrics of these 24 independent models for precipitation and mean temperature are presented in Fig. 1. The figure shows that GFDL-ESM4, with an average skill score of 0.80 for precipitation and temperature, demonstrates the highest performance. In particular, GFDL-ESM4 and CESM2 show the highest skill scores for precipitation BIAS and ANC-BIAS, while ACCESS-ESM1-5 ranks highest for temperature IAV. ACCESS-ESM-1–5 and HadGEM-GC31-LL follow as second top-performing models with an average score of 0.75. Seven models achieve an average score of 0.70, following four models with score of 0.65. However, the lowest score is achieved by CAS-ESM2-0. Considering the average skill score of models, which is 0.63, as the threshold, we selected the top eight models that have skill scores equaling or exceeding the threshold and have precipitation and temperature (mean: Tmean, minimum: Tmin and maximum: Tmax) datasets across all four SSP scenarios. These models include ACCESS-ESM1-5, BCC-CSM2-MR, CanESM5, EC-Earth3-Veg, GFDL-ESM4, MPI-ESM1-2-HR, MRI-ESM2-0, and NESM3. These models reasonably capture spatial precipitation patterns, with highest rainfall in the southwest and lowest in the Empty Quarter, despite magnitude differences (see Supplementary Fig. S1). The performance skills for the eight selected models are detailed in Table S2. These top models exhibit high performance on most statistics, except TREND-PCC for precipitation (Fig. 1). In fact, for a few models, BIAS exceeds 0.95 for precipitation and temperature, confirming that these models indeed exhibit high fidelity in replicating observations.
The spatial patterns of precipitation, PET, and drought indices simulated by these eight models over the reference and future periods are discussed in the next section. In the following section, we present the MMM statistics obtained from the data outputs of these top eight models to evaluate the future hydroclimatic and drought changes over the AP.
Observed hydroclimatic patterns
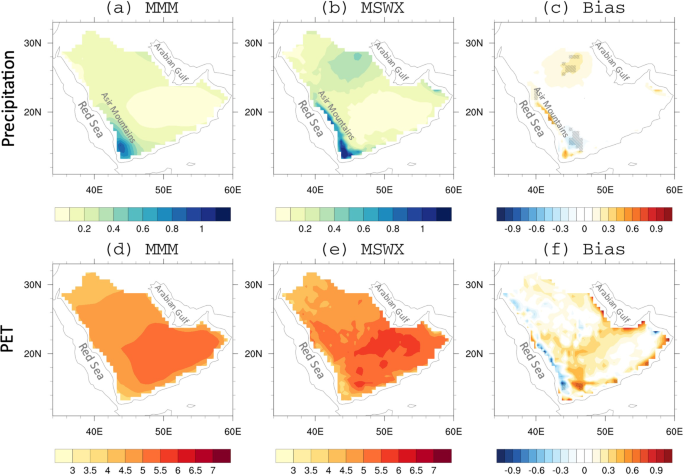
Figure 2 shows the spatial distributions of the mean annual precipitation and PET across the AP from the MSWX and the MMM, and their biases over the reference period 1985–2014. The MSWX observations (Fig. 2a) indicate that the southwestern coastal region west of the Asir Mountains receives the highest precipitation in the AP, while the Empty Quarter region receives minimal to no precipitation, which is in line with earlier observational studies16. The MMM reproduces these distributions well qualitatively (Fig. 2a and b). The precipitation in the MMM reveals a remarkable concurrence with observations, as evidenced by the minimal absolute biases (± 0.1 mm/day) over the significant Southwest and Northern regions (Fig. 2c). Due to the low precipitation, actual biases are quite low, however, the bias exceeds ± 100% when shown as a percentage difference (see Supplementary Fig. S2). We also compared MSWX precipitation with station’s data for the period 1991–2020 and found that MSWX well aligns with observations (see Supplementary Fig. S3). The higher rainfall in the northern peninsula region is primarily due to transient winter activities, which are not well represented by the low-resolution GCMs, leading to MSWX’s overestimation of precipitation. The pattern correlation between MSWX and MMM of precipitation is 0.77, which is highly significant at a 99% confidence level.
The mean PET over the Empty Quarter is maximum in both the MMM and the MSWX (Fig. 2d and e). The model simulations generally underestimate PET, except along the southwestern boundaries (Fig. 2f). The actual biases in PET are quite high, which may be due to the PET values being higher than the precipitation values. However, the bias, when expressed as percentage differences (a maximum of ± 20%), is comparatively less than that of the precipitation (see Supplementary Fig. S2). The pattern correlation between MSWX and MMM is 0.81, which is higher than that for precipitation. Most of the regions with low precipitation exhibit high PET, which is also well simulated by the MMM. A negative association between PET and precipitation is expected over arid regions66. The arid conditions lead to high evaporative demand throughout the year, which causes higher PET than precipitation.
The supplementary Fig. S4 shows the annual cycles of both precipitation and PET simulated by the eight individual GCMs and the MMM compared against the observations. The MMM shows better performance in replicating the observed annual cycles of PET and precipitation than do the individual models. In addition, the MMM exhibits comparatively better fidelity in reproducing the observed annual cycle of PET relative to that of the precipitation. Nonetheless, the MMM exhibits reasonable competency in capturing the broad-scale spatiotemporal patterns of both variables.
Historical drought distribution and characteristics
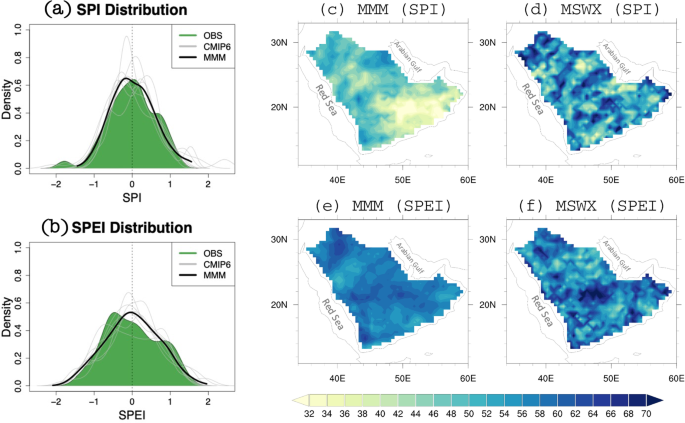
Figure 3a and b depicts the observed and simulated kernel density estimations (KDE) analysis of the SPI and SPEI for 1985–2014. KDE is a non-parametric statistical technique used to estimate the probability density function (PDF) of the drought indices67. We have applied this method on the SPI/SPEI time series and noticed that the observational distributions of the two drought indices differ notably. The SPEI distribution has a negatively skewed peak, indicating more frequent droughts compared to wet events, while the SPI distribution is more symmetric with a central peak. The SPI shows a lower frequency of severe droughts than the SPEI. Thus, considering both precipitation and PET (temperature) results in more frequent droughts than considering only precipitation, where normal conditions are more common. The MMM of SPEI and SPI distributions captures the observational pattern with minor differences. The temporal variability of SPI and SPEI is similar, with a mean correlation over 0.80, whether using observations or MMM, indicating that PET and precipitation covary significantly in the region. The MMM peak for the SPEI distribution is slightly flatter and lower than the observational distribution. Overall, the MMM of SPI and SPEI distributions aligns with observations, capturing the higher magnitudes at the tails, confirming MMM’s ability to represent extreme distributions of both indices.
Figure 3c and f present the total drought duration (in months) during the period 1985–2014 across the AP. The average DD derived from MMM based on the SPI/SPEI (Fig. 3c) aligns reasonably with observations. However, a notable discrepancy between the MSWX and MMM can also be noted over a few regions for both the indices. The SPEI distributions derived together from observations and simulations indicate a relatively longer DD in the region than those from the SPI. This can be attributed to the increasingly dominant role of temperature, which is factored in the SPEI computation16. The MMM shows more differences between the SPI and SPEI than observations because of it have larger biases between precipitation and PET. In summary, our analysis confirms the potential of the simulated indices, especially the SPEI, to capture and characterize drought characteristics with reasonable accuracy while aligning with prior observation-based scientific findings.
Future hydroclimatic changes
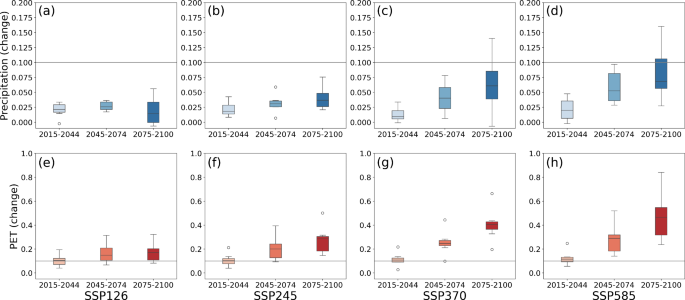
We investigate the projected changes in precipitation and PET, the two most crucial drought drivers, using the suite of eight selected CMIP6-GCMs. Figure 4 depicts the projected changes in future precipitation and PET relative to the reference period and across three distinct scenarios and various future subperiods. Interestingly, all models show an increase in both precipitation and PET over the projected period regardless of the scenario. Significant differences in magnitude are seen across the scenarios and models. Interestingly, the maximum increase in precipitation and the minimum increase in PET are projected to be of the same range 0.10 mm/day. In general, the rate of increase in PET exceeds that of precipitation by a factor of five across all scenarios.
The projected increase in precipitation reveals a consistent increase from the near to the far future, except in the SSP126 scenario, which simulates a maximum change in the mid future (Fig. 4). However, the evolution of the corresponding PET exhibits a consistent increase from the near to the far future in all scenarios. Specifically, most models show only a slight increase in precipitation for the SSP126 scenario and reach a maximum of up to 0.05 mm/day by the end of the century, while they show a much higher increase of 0.3 mm/day in PET (Fig. 4a and d). Notably, for the SSP126 scenario, inter-model biases in the precipitation are the highest in the far future, while in PET, the mid- and far future biases are quite similar. In the SSP245 scenario, precipitation and PET exhibit a consistent increasing trend from the near to far future, with PET suggesting comparatively higher increase (Fig. 4b and e). The evolution of the projected precipitation is coherent over the 21st century, except for two outliers during the mid-future. However, in the case of PET, inter-model differences are minimal only in the near future. The percentage changes in the precipitation and PET by the end of the 21st century is higher for the SSP370 and SSP585 scenario than for other scenarios. Although the upper quartiles for precipitation and PET exhibit fourfold changes from the near to far future in this scenario, the magnitude of the PET increase is more than five times that of precipitation in absolute terms. Furthermore, although the median of the projected precipitation undergoes a slight shift, PET undergoes substantial changes from the near to far future. An appraisal of the evolution of the median PET for all scenarios suggests that PET will be stable in the near future regardless of any increase in radiative forcing. However, we find that PET is projected to increase with radiative forcing and over time in the mid and far future. Indeed, the uncertainties in precipitation and PET indicated by the models are relatively low and within the same range in SSP126 from near to far future. However, the uncertainties increase with radiative forcing, and the highest uncertainties are observed for SSP585, with exception of SSP370 in PET. The pattern correlation between precipitation and PET remains consistently negative across SSPs in the future subperiods and is similar to that over the reference period. Such a relationship can generally be expected over arid regions because of regions’ consistent dry conditions66.
Because PET is directly derived from temperature, these two are positively and highly correlated. However, correlation values are expected to vary under different emission scenarios. The highest correlation of 0.92 (see Supplementary Table S3) between them in the future is simulated for the SSP585 scenario, which indicates that the association between PET and temperature increases as the temperature increases due to increased radiative forcing. Such a relationship between PET and temperature is generally expected over lower and middle latitudes, as was noted earlier68.
Projected drought variability and associated uncertainties
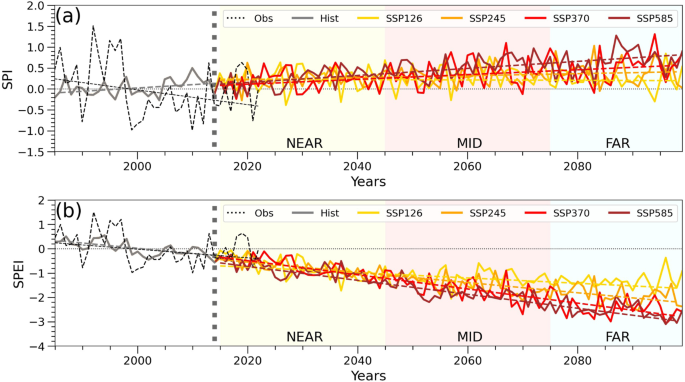
We explored the temporal variability and trends in the droughts over the AP using the observations and the MMM of the eight selected CMIP6-GCMs for the historical over all four scenarios for the future (Fig. 5). The observations show a significant negative trend in the SPI and SPEI for the period 1985–2022, which cover the historical period (1980–2014) and the initial eight years (2015–2022) of future simulations. However, the MMM of SPI shows consistently positive trends for the historical period and for all the SSP scenarios at the end of the century. The SSP585 and SSP370 followed by the SSP245, shows the maximum change in SPI in comparison with the simulated SPI for the reference period, and a relatively small change is shown for SSP126. The opposite SPI pattern shown by models and the observations is due to the high percentage difference in precipitation between the datasets (see Supplementary Fig. S2) which signify the limited capability of the models to reproduce the SPI during this period (Fig. 5a).
However, as noted earlier, the model exhibits better fidelity in reproducing the observed PET, on which the SPEI statistics are more dependent than the changes in precipitation in the historical and all emission scenarios. This relationship is confirmed by the highly significant negative correlation (p < 0.01) between SPEI and PET, compared to SPEI and precipitation, which is comparatively lower and positive across the scenario. Indeed, the simulated SPEI also exhibits a negative trend that is in line with observations over the historical period, unlike the SPI (Fig. 5b). Under all future scenarios, drought severity over the AP is projected to consistently intensify from the near to far- future with an increase in radiative forcing. The divergence between the scenarios in the SPEI also increases from near to the far future. A recent study also suggested that global drylands, including AP, will become more susceptible to drought hazards under high-emission scenarios69. These results are calculated based on 1985–2014 considering as base period for fitting the distribution. However, drought indices (SPI/SPEI) calculated using long-term data for distribution fitting show differing evolutions in the historical period and deviate from observed drought variability (see Supplementary Fig. S5). Regardless of scenarios, both indices reach a maximum of ± 1 in the future, which is unlikely under a changing climate.
As discussed above, all SSP scenarios exhibit a positive SPI trend, whose magnitude is less than that of the decreasing SPEI trend. Intriguingly, the ensemble means of temporal variability of the SPI and SPEI shows a significant correlation of 0.84 for SSP126, which decreases to 0.72 for SSP245 and 0.58 and 0.48 for SSP370 and SSP585, respectively. The relatively high rate of the projected PET increase compared with the rate of the corresponding precipitation increase, particularly for the highest emission scenario, is the reason for the weakening of the SPI–SPEI correlations from low to high emission scenarios. The increased temperature in the high-emission scenario is responsible for the high drought frequency in the AP, as projected by the SPEI. We recall from the analysis of the observational SPI and SPEI over the historical period that (a) drought conditions increased over the region corresponding to the simulated SPEI and (b) simulated SPEI time series, unlike the SPI time series, captures the negative trend. This gives us more confidence for using the SPEI as a reliable drought index for a regional drought analysis. Accordingly, in all our further analyses, we will use the SPEI as an index for future drought analysis.
We should consider that the SPEI-based drought interpretations are sensitive to the choice of PET method. During the reference period, the SPEI derived from observations based on Hargreaves (SPEI-HG) and Thornthwaite (SPEI-TH) methods suggest quite similar drying trends (see Supplementary Fig. S6). However, SPEI-TH suggests an exacerbated drought with an abrupt change, unlike the gradually increasing SPEI-HG over the AP for all SSP scenarios, which is not an obvious pattern. This sudden exacerbation of SPEI-TH is probably because of its sensitivity to rising temperatures, which can be overestimated, as mentioned earlier32,70. Nonetheless, SPEI-HG shows a reasonable pattern for the observational and model simulations.
Overall, all these findings suggest that the severeness and frequency of drought will increase over the study area, regardless of the methods and models employed, and that SPEI-HG is an optimal index for estimating the future droughts from CMIP6 outputs. To gain deeper insight, the projected changes in drought characteristics based on the SPEI-HG are presented in the next section.
Projected changes in drought characteristics and associated uncertainties
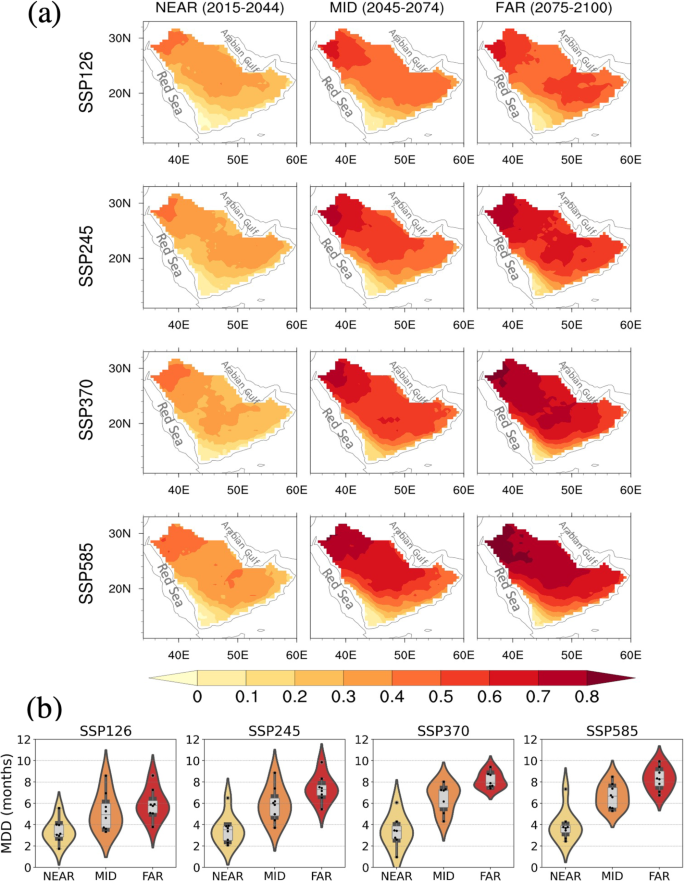
The spatial distributions of projected changes in drought frequency from the MMM for SPEI for all four SSP scenarios are illustrated in Fig. 6a. Over the whole of the AP, the SPEI projections reveal a predominantly increased frequency of drought events, which consistently increase from the near to far future under low to high emission scenarios. The greatest increases in drought frequency are projected over the northernmost region, and the smallest changes are projected over southwestern areas. Among the scenarios, the greatest changes are projected for SSP370 and SSP585 in the far future and reach 300–400% increase in drought frequency in a few locations. The shifts in drought frequency are predominantly influenced by the interplay between precipitation and PET. Given that the projected PET increase generally surpasses that of precipitation throughout the AP (Fig. 4), a substantial increase in drought frequency is foreseen across the region.
Interestingly, when the SPI is employed as the drought index, we observe only a mild reduction in drought frequency over most of the region, except in the northern AP (see Supplementary Fig. S7). Changes in the SPI largely mirror the precipitation pattern, as has been noted in recent studies27,71. Furthermore, the precipitation pattern is subjected to high uncertainty due to the limitations of models in capturing precipitation. Interestingly, these contrasting evolutions between the SPI and SPEI lead to the maximum uncertainty in drought projections, which has also been noted in other regions of the globe32,51,72. As reported in previous on the observations and models, the SPEI was found to be a more appropriate index, given the dominant role of PET (temperature) relative to precipitation, in arid regions such as the AP, unlike regions where precipitation plays a dominant role. Nevertheless, a more detailed discussion will be necessary to select goal-based indices that represent droughts in the AP region. Additionally, supplementary Fig. S8 illustrates that the timescale for which the drought index is calculated, also contributes to uncertainty in the future drought evolution. In summer, the northern AP regions are comparatively more prone to drought, whereas, the southern AP region is expected to show a higher drought frequency in winter. Seasonally, the difference between northern and southern region have also been noticed in observational studies73. Interestingly, we observe that the timescale (winter, summer, or annual) mostly affects the severity and spatial pattern of magnitude, whereas the sign of change remains the same.
Figure 6b presents violin plots of projected mean drought duration (MDD) (months/year) changes across all SSP scenarios from the near to far future. MDD is expected to increase significantly in all scenarios, with high inter-model uncertainty. In SSP126, MDD ranges from 2 to 8 months/year, reaching up to 10 months/year in SSP245, SSP370 and SSP585. The median distribution shows a consistent upward trend in each scenario. One or two outlier models contribute to the high uncertainty. There is better agreement between the models in SSP585 and SSP370 in far future, unlike in the other two scenarios.
Summary and conclusions
This study provides a comprehensive analysis of the projected changes in drought across the AP region until the end of the 21st century, along with an uncertainty assessment using a multi-model and multi-index approach under four CMIP6 emission scenarios. Furthermore, this study systematically explores the primary sources of uncertainty in drought projections, which are associated with the index selection, scenario variability, modeling uncertainty, timescale selection, and adapted methodology. The key findings are as follows.
- 1.We selected 24 independent models from 57 CMIP6-GCMs after analyzing their inter-model dependences during the historical period. Subsequently, we further narrowed our selection to the best eight models based on an analysis of precipitation, temperature, and drought statistics. These eight models demonstrated reasonable ability to simulate the regional hydroclimatic patterns of the AP. In particular, the model-simulated PET captured the AP regional climate better than it captured precipitation.
- 2.Both precipitation and PET are projected to increase in the future; however, the rate of change for PET was much higher than that for precipitation. This is due to the higher warming rate and consequently greater evaporative demand over the AP, which is highest in the SSP585 scenario, followed by SSP370, SSP245 and SSP126 scenarios. The inter-model spread consistently increased from the near to far future in all emission scenarios.
- 3.The SPI exhibited a moderate wetting trend unlike the SPEI, which showed a significant drying. This divergence arises from PET, which increases considerably over the AP region due to increased warming. However, we narrowed our focus to the SPEI-based drought projection because SPI was unable to capture the drought trend.
- 4.Drought frequency and duration based on the SPEI showed a consistent increasing trend from the near- to far- future, which was more pronounced in SSP585 and SSP370, followed by SSP245, and then by SSP126.
- 5.We noted that SPEI-HG was a better method for projecting drought in all four emission scenarios than SPEI-TH, which showed abrupt changes even for 2015–2022 when no such signals were observed.
- 6.The seasonal cycle affects the spatial pattern of drought distribution, demonstrating greater drought frequency in summer (winter) over the northern (southern) region.
- 7.The projected changes in the temperature along with an increase in the atmospheric evaporative demand increase potential risks to crop productivity over the AP.
Overall, our findings support the general perspective of dry gets drierunder changing climate conditions74. Stark differences between the SPI and SPEI based drought projections highlight the need to better understand the interplay between atmospheric evaporative demand and available moisture content under a changing climate. This point has also been highlighted in other recent studies51. This research analyzes future drought projections in the AP, addressing uncertainties and providing insights for policymakers in Saudi Arabia and the Gulf regions to improve water resource management. We recommend to adopt drought-resistant crops, soil-moisture retention practices to reduce PET for mitigating future drought risks. Our findings support regional initiatives such as the Saudi Green Initiative, Red Sea Global under Saudi Vision 2030, emphasizing integrated water conservation policies based on scenario informed planning considering uncertainties in drought projections. Addressing uncertainty in modeling GCMs can be advanced by a comprehensive understanding of the regional process in high-resolution and regionally tailored climate models, which is slated for exploration in the future studies.
Data availability
All the datasets used in this study are publicly available in different open portals except station rainfall datasets. The station rainfall datasets have been provided from NCM, Saudi Arabia on personal request. The MSWX data are available from https://www.gloh2o.org/mswx/ (Beck et al., 2022). The CMIP6 data are available to registered users from https://aims2.llnl.gov/search/cmip6/. We have used Python (https://www.python.org/downloads/release/python-397/) and NCAR Command Language (NCL) (Software installation link: https://www.ncl.ucar.edu/Download/conda.shtml) software for plotting all the figures.
References
- IPCC, Summary for Policymakers. : The Physical Science Basis. Contribution of Working Group I to the Sixth Assessment Report of the Intergovernmental Panel on Climate Change[Masson-Delmotte, V., P. Zhai, A. Pirani, et al., (eds.)]. Cambridge University Press, Cambridge, United Kingdom and New York, NY, USA, pp. 3 – 32. (2021).In: Climate Change (2021).
- Seneviratne, S. I. et al. Weather and Climate Extreme events in a changing climate. In Climate Change the1: The Physical Science Basis. Contribution of Working Group I to the Sixth Assessment Report of the Intergovernmental Panel on Climate Change [Masson-Delmotte, (eds Zhai, V. P. & Pirani, A.) ]. Cambridge University Press, Cambridge, United Kingdom and New York, NY, USA, 1513–1766. (2021).MATH Google Scholar
- Perkins-Kirkpatrick, S. E. et al. On the attribution of the impacts of extreme weather events to anthropogenic climate change. Environ. Res. Lett. 17, 024009 (2022).Article ADS Google Scholar
- Trenberth, K. E. et al. Global warming and changes in drought. Nat. Clim. Chang. 4, 17–22 (2014).Article ADS Google Scholar
- Lewis, S. C. & King, A. D. Evolution of mean, variance and extremes in 21st century temperatures. Weather Clim. Extrem. 15, 1–10 (2017).Article MATH Google Scholar
- Mueller, B. & Zhang, X. Causes of drying trends in northern hemispheric land areas in reconstructed soil moisture data. Clim. Change. 134, 255–267 (2016).Article ADS Google Scholar
- Qin, T. et al. Continued decline of global soil moisture content, with obvious soil stratification and regional difference. Sci. Total Environ. 864, 160982 (2023).Article CAS PubMed Google Scholar
- Sheffield, J. & Wood, E. F. Global trends and variability in soil moisture and drought characteristics, 1950–2000, from observation-driven simulations of the terrestrial hydrologic cycle. J. Clim. 21, 432–458 (2008).Article ADS MATH Google Scholar
- Burke, E. J. & Brown, S. J. Evaluating uncertainties in the Projection of Future Drought. J. Hydrometeorol. 9, 292–299 (2008).Article ADS MATH Google Scholar
- Sheffield, J., Wood, E. F. & Roderick, M. L. Little change in global drought over the past 60 years. Nature 491, 435–438, (2012).
- Roudi-Fahimi, F. & Kent, M. M. Challenges and opportunities—the population of the Middle East and North Africa. Popul. Bull. 62, 1–19 (2007).MATH Google Scholar
- Barlow, M. et al. A review of Drought in the Middle East and Southwest Asia. J. Clim. 29, 8547–8574 (2016).Article ADS MATH Google Scholar
- Zittis, G. et al. Climate Change and Weather extremes in the Eastern Mediterranean and Middle East. Rev. Geophys. 60, e2021RG000762 (2022).Article ADS Google Scholar
- Douville, H. et al. R.P. : Water Cycle Changes. In Climate Change 2021: The Physical Science Basis. Contribution of Working Group I to the Sixth Assessment Report of the Intergovernmental Panel on Climate Change [Masson-Delmotte, V., P. Zhai, A. Pirani, S.L. (eds.)]. Cambridge University Press, Cambridge, United Kingdom and New York, NY, USA, pp. 1055–1210. (2021).
- Syed, F. S., Adnan, S., Zamreeq, A. & Ghulam, A. Identification of droughts over Saudi Arabia and global teleconnections. Nat. Hazards. 112, 1–21 (2022).
- Saharwardi, M. S., Dasari, H. P., Aggarwal, V., Ashok, K. & Hoteit, I. Long-Term Variability in the Arabian Peninsula Droughts Driven by the Atlantic Multidecadal Oscillation. Earth’s Futur. 11, eEF003549 (2023). (2023).
- Almazroui, M., Nazrul Islam, M., Saeed, S., Alkhalaf, A. K. & Dambul, R. Assessment of uncertainties in projected temperature and precipitation over the Arabian Peninsula using three categories of CMIP5 multimodel ensembles. Earth Syst. Environ. 1, 1–20 (2017).ADS MATH Google Scholar
- Almazroui, M., Islam, M. N., Saeed, S., Saeed, F. & Ismail, M. Future changes in climate over the Arabian Peninsula based on CMIP6 Multimodel simulations. Earth Syst. Environ.4, 611–630 (2020).Article MATH Google Scholar
- Amin, M. T., Mahmoud, S. H. & Alazba, A. A. Observations, projections and impacts of climate change on water resources in Arabian Peninsula: current and future scenarios. Environ. Earth Sci. 75, 1–17 (2016).Article CAS MATH Google Scholar
- Tabari, H. & Willems, P. More prolonged droughts by the end of the century in the Middle East. Environ. Res. Lett. 13, 104005 (2018).Article ADS MATH Google Scholar
- Waha, K. et al. Climate change impacts in the Middle East and Northern Africa (MENA) region and their implications for vulnerable population groups. Reg. Environ. Chang. 17, 1623–1638 (2017).Article MATH Google Scholar
- Fan, X., Duan, Q., Shen, C., Wu, Y. & Xing, C. Global surface air temperatures in CMIP6: historical performance and future changes. Environ. Res. Lett. 15, 104056 (2020).Article ADS MATH Google Scholar
- Zampieri, M., Alkama, R., Luong, T., Ashok, K. & Hoteit, I. Managing vegetation for stronger cooling efficiency during hot days in the Arabian Peninsula. Ecol. Indic. 154, 110789 (2023).Article Google Scholar
- Pour, S. H., Wahab, A. K. A. & Shahid, S. Spatiotemporal changes in aridity and the shift of drylands in Iran. Atmos. Res. 233, 104704 (2020).Article Google Scholar
- Loudyi, D. & Kantoush, S. A. Flood risk management in the Middle East and North Africa (MENA) region. Urban Water J. 17, 379–380 (2020).Article Google Scholar
- Terry, J. P., Al Ruheili, A., Almarzooqi, M. A., Almheiri, R. Y. & Alshehhi, A. K. The rain deluge and flash floods of summer 2022 in the United Arab Emirates: causes, analysis and perspectives on flood-risk reduction. J. Arid Environ. 215, 105013 (2023).Article ADS Google Scholar
- Rao, K. K. et al. Future changes in the precipitation regime over the Arabian Peninsula with special emphasis on UAE: insights from NEX-GDDP CMIP6 model simulations. Sci. Rep. 2024. 141 14, 1–21 (2024).Google Scholar
- Collins, M. et al. Observational challenges in evaluating climate models. Nat. Clim. Chang. 311 (3), 940–941 (2013). (2013).Article ADS MATH Google Scholar
- Pathak, R., Dasari, H. P., Ashok, K. & Hoteit, I. Effects of multi-observations uncertainty and models similarity on climate change projections. npj Clim. Atmos. Sci. 6, 1–12 (2023). (2023).
- Taylor, I. H. et al. Hydrology and Earth System sciences discussions contributions to uncertainty in projections of future drought under climate change scenarios. Hydrol. Earth Syst. Sci. Discuss. 9, 12613–12653 (2012).ADS MATH Google Scholar
- Herrera-Estrada, J. E., Sheffield, J., Herrera-Estrada, J. E. & Sheffield, J. Uncertainties in future projections of summer droughts and Heat Waves over the Contiguous United States. J. Clim. 30, 6225–6246 (2017).Article ADS MATH Google Scholar
- Saharwardi, M. S. & Kumar, P. Future drought changes and associated uncertainty over the homogenous regions of India: a multimodel approach. Int. J. Climatol. https://doi.org/10.1002/JOC.7265 (2021).Article Google Scholar
- Deser, C., Phillips, A., Bourdette, V. & Teng, H. Uncertainty in climate change projections: the role of internal variability. Clim. Dyn. 38, 527–546 (2012).Article Google Scholar
- Zhao, T. & Dai, A. CMIP6 model-projected Hydroclimatic and Drought Changes and their causes in the twenty-First Century. J. Clim. 35, 897–921 (2022).ADS MATH Google Scholar
- Vuuren, D. P. et al. The representative concentration pathways: an overview. Clim. Change. 109, 5–31 (2011).Article ADS MATH Google Scholar
- Orlowsky, B. & Seneviratne, S. I. Elusive drought: uncertainty in observed trends and short-and long-term CMIP5 projections. Hydrol. Earth Syst. Sci. 17, 1765–1781 (2013).Article ADS MATH Google Scholar
- Mahmoud, S. H., Gan, T. Y. & Zhu, D. Z. Impacts of climate change and climate variability on water resources and drought in an arid region and possible resiliency and adaptation measures against climate warming. Clim. Dyn. 61, 4079–4105 (2023).Article MATH Google Scholar
- Knutti, R., Furrer, R., Tebaldi, C., Cermak, J. & Meehl, G. A. challenges in combining projections from multiple climate models. J. Clim. 23, 2739–2758 (2010).Article ADS Google Scholar
- Flato, G. et al. P., : Evaluation of Climate models. In: Climate Change 2013: The Physical Science Basis. Contribution of Working Group I to the Fifth Assessment Report of the Intergovernmental Panel on Climate Change [Stocker, (eds Qin, T. F. D., Plattner, G. K. et al.) ]. Cambridge University Press, Cambridge, United Kingdom and New York, NY, USA. 741-866, (2013).MATH Google Scholar
- O’Neill, B. C. et al. The scenario Model Intercomparison Project (ScenarioMIP) for CMIP6. Geosci. Model. Dev. 9, 3461–3482 (2016).Article ADS MATH Google Scholar
- Touma, D., Ashfaq, M., Nayak, M. A., Kao, S. C. & Diffenbaugh, N. S. A multi-model and multi-index evaluation of drought characteristics in the 21st century. J. Hydrol. 526, 196–207 (2015).Article ADS Google Scholar
- Supharatid, S., Nafung, J. & Aribarg, T. Projected changes in temperature and precipitation over mainland Southeast Asia by CMIP6 models. J. Water Clim. Chang. 13, 337–356 (2022).Article Google Scholar
- You, Q. et al. Temperature dataset of CMIP6 models over China: evaluation, trend and uncertainty. Clim. Dyn. 57, 17–35 (2021).Article MATH Google Scholar
- Maraun, D. Bias Correcting Climate Change Simulations – a Critical Review. Current Climate Change Reports vol. 2 211–220 at (2016). https://doi.org/10.1007/s40641-016-0050-x
- Ahmed, K., Sachindra, D. A., Shahid, S., Demirel, M. C. & Chung, E. S. Selection of multi-model ensemble of general circulation models for the simulation of precipitation and maximum and minimum temperature based on spatial assessment metrics. Hydrol. Earth Syst. Sci. 23, 4803–4824 (2019).Article ADS Google Scholar
- Beck, H. E. et al. Global 3-Hourly 0.1° Bias-Corrected Meteorological Data Including Near-Real-Time updates and Forecast ensembles. Bull. Am. Meteorol. Soc. 103. MSWX, E710–E732 (2022).Article MATH Google Scholar
- Lutz, A. F. et al. Selecting representative climate models for climate change impact studies: an advanced envelope-based selection approach. Int. J. Climatol. 36 (12), 3988–4005 (2016).Article MATH Google Scholar
- Abramowitz, G. et al. ESD reviews: model dependence in multi-model climate ensembles: Weighting, sub-selection and out-of-sample testing. Earth Syst. Dyn. 10, 91–105 (2019).Article ADS MATH Google Scholar
- Merrifield, A. L., Brunner, L., Lorenz, R., Humphrey, V. & Knutti, R. Climate model selection by Independence, Performance, and spread (ClimSIPS v1.0.1) for regional applications. Geosci. Model. Dev. 16, 4715–4747 (2023).Article ADS Google Scholar
- Kotlarski, S. et al. Observational uncertainty and regional climate model evaluation: a pan-european perspective. Int. J. Climatol. 39, 3730–3749 (2019).Article MATH Google Scholar
- Reyniers, N., Osborn, T. J., Addor, N. & Darch, G. Projected changes in droughts and extreme droughts in Great Britain strongly influenced by the choice of drought index. Hydrol. Earth Syst. Sci. 27, 1151–1171 (2023).Article ADS Google Scholar
- Almazroui, M., Islam, M. & Nazrul Coupled Model Inter-comparison Project Database to Calculate Drought Indices for Saudi Arabia: a preliminary Assessment. Ear. Syst. and Environ. 3, 419–428 (2019).
- Vicente-Serrano, S. M., Beguería, S. & López-Moreno, J. I. Comment on characteristics and trends in various forms of the Palmer Drought Severity Index (PDSI) during 1900–2008 by Aiguo Dai. J. Geophys. Res. Atmos. 116, 19112 (2011).Article ADS Google Scholar
- Liu, Y. et al. A multiscalar Palmer drought severity index. Geophys. Res. Lett. 44, 6850–6858 (2017).Article ADS MATH Google Scholar
- Mckee, T. B., Doesken, N. J. & Kleist, J. The relationship of drought frequency and duration to time scales. Eighth Conference on Applied Climatology (1993).
- Vicente-Serrano, S. M., Beguería, S., López-Moreno, J. I. & Angulo, M. El Kenawy, A. A New Global 0.5° gridded dataset (1901–2006) of a Multiscalar Drought Index: comparison with current Drought Index datasets based on the Palmer Drought Severity Index. J. Hydrometeorol. 11, 1033–1043 (2010).Article ADS Google Scholar
- Saharwardi, M. S., Kumar, P., Dubey, A. K. & Kumari, A. Understanding spatiotemporal variability of drought in recent decades and its drivers over identified homogeneous regions of India. Q. J. R Meteorol. Soc. 148, 2955–2972 (2022).Article ADS MATH Google Scholar
- Hargreaves, G. H. & Samani, Z. A. Reference crop evapotranspiration from temperature. Appl. Eng. Agric. 1, 96–99 (1985).Article MATH Google Scholar
- Kingston, D. G., Todd, M. C., Taylor, R. G. & Thompson, J. R. Arnell, N. W. Uncertainty in the estimation of potential evapotranspiration under climate change. Geophys. Res. Lett.36, L20403 (2009).Article ADS Google Scholar
- Dong, Z. et al. Future projection of seasonal drought characteristics using CMIP6 in the Lancang-Mekong River Basin. J. Hydrol. 610, 127815 (2022).Article MATH Google Scholar
- Thornthwaite, C. W. An Approach toward a rational classification of climate. Geogr. Rev.38, 55 (1948).Article Google Scholar
- Kwon, M., Sung, J. H., Kwon, M. & Sung, J. H. Changes in Future Drought with HadGEM2-AO projections. Water 11, 312 (2019).Article MATH Google Scholar
- Wang, T., Tu, X., Singh, V. P., Chen, X. & Lin, K. Global data assessment and analysis of drought characteristics based on CMIP6. J. Hydrol. 596, 126091 (2021).Article Google Scholar
- Um, M. J., Kim, Y., Park, D. & Kim, J. Effects of different reference periods on drought index (SPEI) estimations from 1901 to 2014. Hydrol. Earth Syst. Sci. 21, 4989–5007 (2017).Article ADS MATH Google Scholar
- Aadhar, S. & Mishra, V. On the projected decline in droughts over South Asia in CMIP6 Multimodel Ensemble. J. Geophys. Res. Atmos. 125, e2020JD033587 (2020).Article ADS Google Scholar
- Trenberth, K. E. & Shea, D. J. Relationships between precipitation and surface temperature. Geophys. Res. Lett. 32, 1–4 (2005).Article MATH Google Scholar
- Pavlides, A., Agou, V. D. & Hristopulos, D. T. Non-parametric kernel-based estimation and simulation of precipitation amount. J. Hydrol. 612, 127988 (2022).Article MATH Google Scholar
- Fu, R. et al. Attribution of air temperature and precipitation to the future global drought events. Environ. Res. Commun. 5, 061005 (2023).Article Google Scholar
- Huang, M. et al. Drylands face potential threat of robust drought in the CMIP6 SSPs scenarios. Environ. Res. Lett. 16, 114004 (2021).Article ADS MATH Google Scholar
- Aadhar, S. & Mishra, V. Increased Drought Risk in South Asia under warming climate: implications of uncertainty in potential evapotranspiration estimates. J. Hydrometeorol. 21, 2979–2996 (2020).Article ADS MATH Google Scholar
- Almazroui, M. Assessment of meteorological droughts over Saudi Arabia using surface rainfall observations during the period 1978–2017. Arab. J. Geosci. 12, 1–16 (2019).Article Google Scholar
- Haile, G. G. et al. Projected Impacts of Climate Change on Drought Patterns Over East Africa. Earth’s Futur. 8, eEF001502 (2020). (2020).
- Saharwardi, M. S., Dasari, H. P., Gandham, H., Ashok, K. & Hoteit, I. Spatiotemporal variability of hydro-metrological droughts over the Arabian Peninsula and associated mechanisms. Sci. Rep. 14, 20296 (2024). (2024).
- Held, I. M. & Soden, B. J. Robust responses of the Hydrological cycle to global warming. J. Clim. 19, 5686–5699 (2006).Article ADS MATH Google Scholar
Acknowledgements
This research work was supported by the Climate Change Center, an initiative of the National Center for Meteorology (NCM), Kingdom of Saudi Arabia (Ref No: RGC/03/4829-01-01). We are thankful to all the agencies for freely providing the datasets.
Author information
Authors and Affiliations
- Physical Science and Engineering Division, King Abdullah University of Science and Technology, Thuwal, Kingdom of Saudi ArabiaMd Saquib Saharwardi, Hari Prasad Dasari, Waqar Ul Hassan, Harikishan Gandham, Raju Pathak, Matteo Zampieri, Karumuri Ashok & Ibrahim Hoteit
- Climate Change Center, National Center for Meteorology, Jeddah, 21431, Saudi ArabiaMd Saquib Saharwardi, Hari Prasad Dasari, Harikishan Gandham, Raju Pathak, Matteo Zampieri & Karumuri Ashok
Contributions
M.S.S. and I.H. took the overall lead in designing the current study. M.S.S. analyzed data and created all the figures. M.S.S. wrote the paper with help from H.P.D., W.H., H. G, R.P., M.Z., K.A. and I.H. All authors participated in the review and editing.
Corresponding author
Ethics declarations
Competing interests
The authors declare no competing interests.
Supplementary Information
There is another separate file for supplementary information.
Additional information
Publisher’s note
Springer Nature remains neutral with regard to jurisdictional claims in published maps and institutional affiliations.
Electronic supplementary material
Below is the link to the electronic supplementary material.
Supplementary Material 1
Rights and permissions
Open Access This article is licensed under a Creative Commons Attribution-NonCommercial-NoDerivatives 4.0 International License, which permits any non-commercial use, sharing, distribution and reproduction in any medium or format, as long as you give appropriate credit to the original author(s) and the source, provide a link to the Creative Commons licence, and indicate if you modified the licensed material. You do not have permission under this licence to share adapted material derived from this article or parts of it. The images or other third party material in this article are included in the article’s Creative Commons licence, unless indicated otherwise in a credit line to the material. If material is not included in the article’s Creative Commons licence and your intended use is not permitted by statutory regulation or exceeds the permitted use, you will need to obtain permission directly from the copyright holder. To view a copy of this licence, visit http://creativecommons.org/licenses/by-nc-nd/4.0/.
About this article
Cite this article
Saharwardi, M.S., Dasari, H.P., Hassan, W.U. et al. Projected increase in droughts over the Arabian Peninsula and associated uncertainties. Sci Rep 15, 1711 (2025). https://doi.org/10.1038/s41598-025-85863-w
- Received30 July 2024
- Accepted06 January 2025
- Published11 January 2025
- DOIhttps://doi.org/10.1038/s41598-025-85863-w
Share this article
Anyone you share the following link with will be able to read this content:Get shareable link
Provided by the Springer Nature SharedIt content-sharing initiative
Subjects
- Sections
- Figures
- References